
The Salary Raise Math Problem
The raise you earned and the raise you needed are rarely the same number.


Before we get into the math, a promise: by the end of this piece, you will have a simple, repeatable method for calculating your own personal inflation rate using publicly available data, and for testing whether any raise you receive is real or nominal. Those two words matter, and they are worth defining before anything else. A nominal raise is the number on the paper: the percentage your employer announces, the digits that move in your bank account. A real raise is what that number actually buys you after accounting for the fact that prices have moved since the last time you were paid. Nominal is the face value. Real is the purchasing power. They can move in opposite directions, and in Ethiopia right now, for many people, they are.
You can scroll to the end right now and grab the practical tip if you want. But it will be like being handed a hotel room key with no room number on it. The key is real. Without knowing where you are in the building, it opens nothing.
Read this first…
Somewhere in Addis Ababa right now, a manager is sitting across from a good employee. The employee has been loyal, competent, and present for three years. They want a raise. The manager wants to give them one. The company’s revenues grew maybe 15% this year in nominal Birr terms. That sounds like something. Until you do the math, and it stops sounding like anything at all.
This tension is not uniquely Ethiopian. It plays out in Lagos, in Cairo, in Istanbul, in Buenos Aires. Wherever an economy has moved through a sustained period of high inflation, the same quiet fracture appears: the employee feels underpaid, the manager feels like they are trying, and both of them are standing in a gap that is mathematical before it is emotional. The price of goods has moved so far, so fast, that even a generous-sounding raise can leave someone worse off in real terms than they were two years ago.
Ethiopia is living a particularly concentrated version of this global phenomenon right now. Understanding it requires more than glancing at a headline rate. It requires reading the full picture.
What CPI Is and Why It Uses a Score Instead of Birr
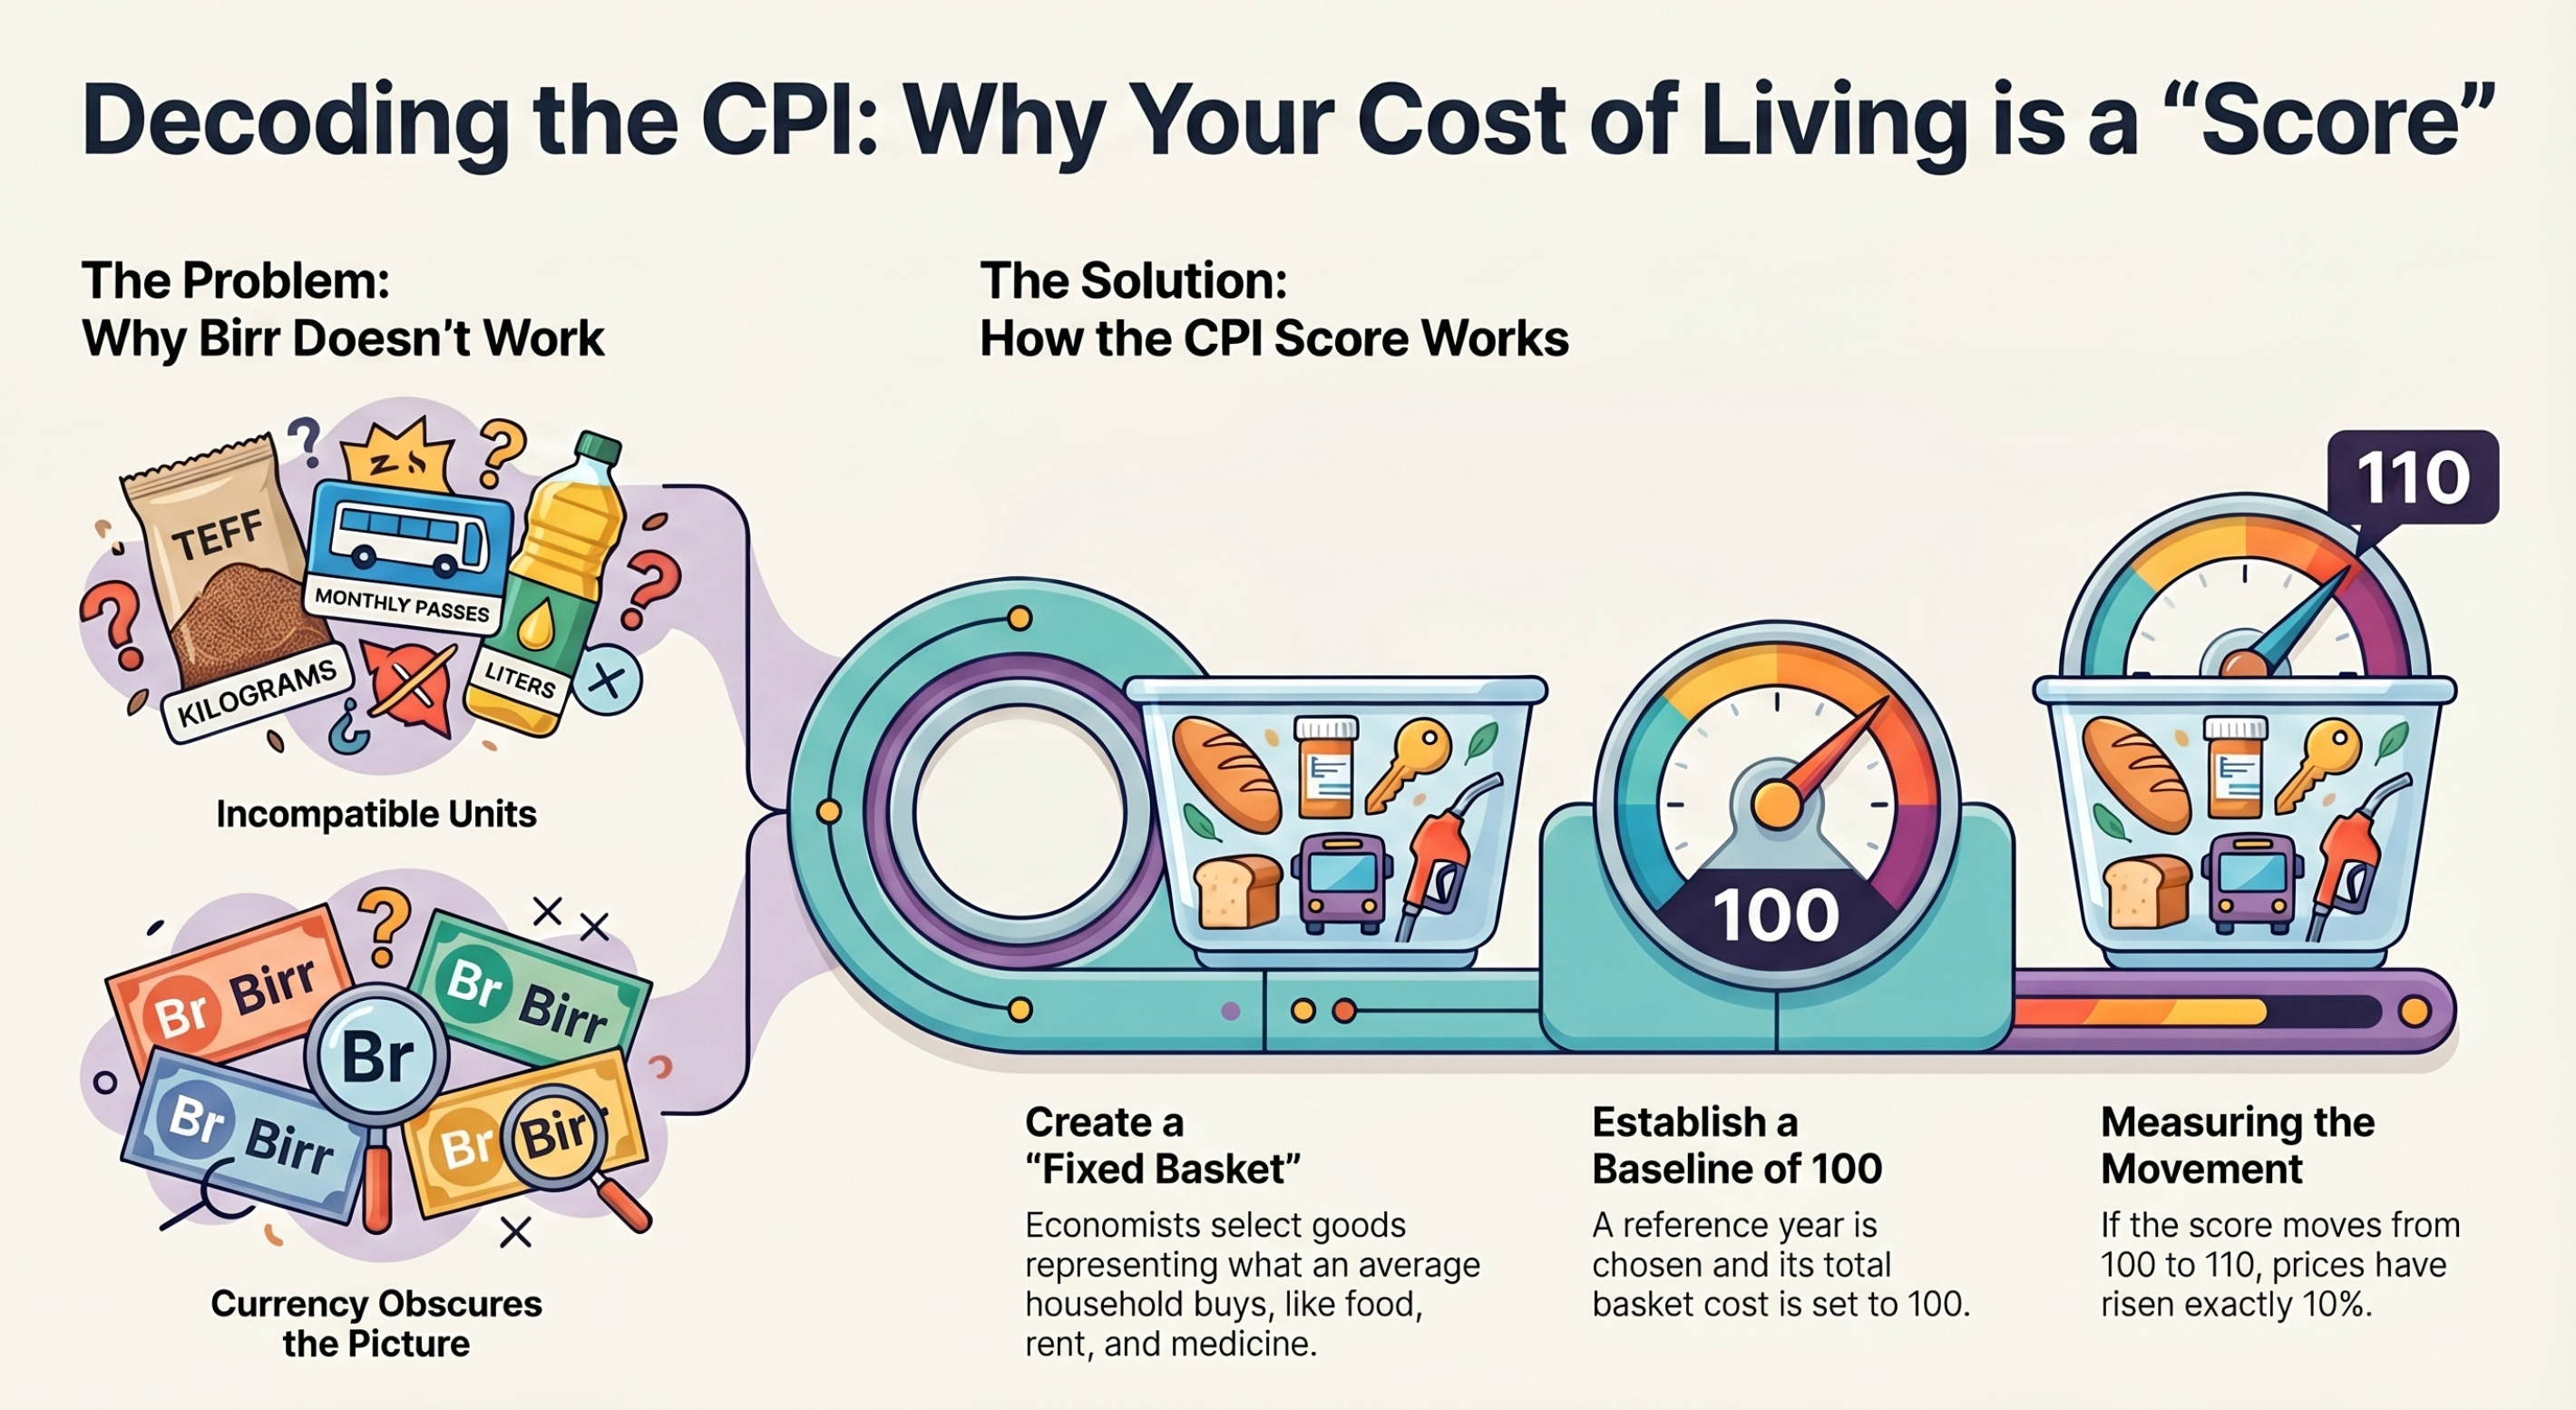
To understand what is happening to your money, you need to understand one tool: the Consumer Price Index, or CPI. But first, a reasonable question: why does the government report prices as a score, like 549 points, rather than simply saying “a basket of groceries costs 2,400 Birr this month”?
Because Birr would break the comparison.
Think about what goes into measuring the cost of life for the average Ethiopian household. You have teff, cooking oil, school fees, bus fares, rent, medicine, and phone credit. Some are measured in kilograms. Some in liters. Some are monthly fees. Some are daily purchases. You cannot meaningfully add a kilogram of teff to a monthly bus pass. The units are incompatible, the way you cannot add apples and distance.
So economists invented a workaround. They take a fixed basket of goods and services that represents roughly what an average household buys in a year. Then they pick a reference year, set the total cost of that basket equal to exactly 100, and call it the baseline. From that point forward, every change in price is expressed as a movement in the score. If the basket that cost 100 points last year now costs 110 points, prices rose by 10%, regardless of whether the Birr figure was 8,000 or 80,000. The score is a universal translator for a complicated and diverse set of goods. It lets you compare this year to last year, and this decade to the previous one, without the Birr figures obscuring the picture.
Think of it like a judge scoring a gymnastics routine. The routine contains a dozen different elements, each assessed differently. The final score converts all of those individual moving parts into one number you can track and compare across years.

Ethiopia set its baseline in 2016. The score at that moment: 100.
According to the Ethiopian Statistics Service March 2026 release, the latest available figures show the CPI at 549.20, with headline inflation at 9.4%, food inflation at 11.0%, and non-food inflation at 7.0%. These are the numbers this article works from.
Since 2016, the cost of that same basket of goods has grown from 100 to 549.20. Life is now 5.5 times more expensive than it was a decade ago. If you were paying 1,000 ETB for a month’s worth of groceries in 2016, you would need 5,492 ETB to buy the exact same representative basket of goods today.
That is not a marginal change. That is a decade-long transformation, and it is still moving.
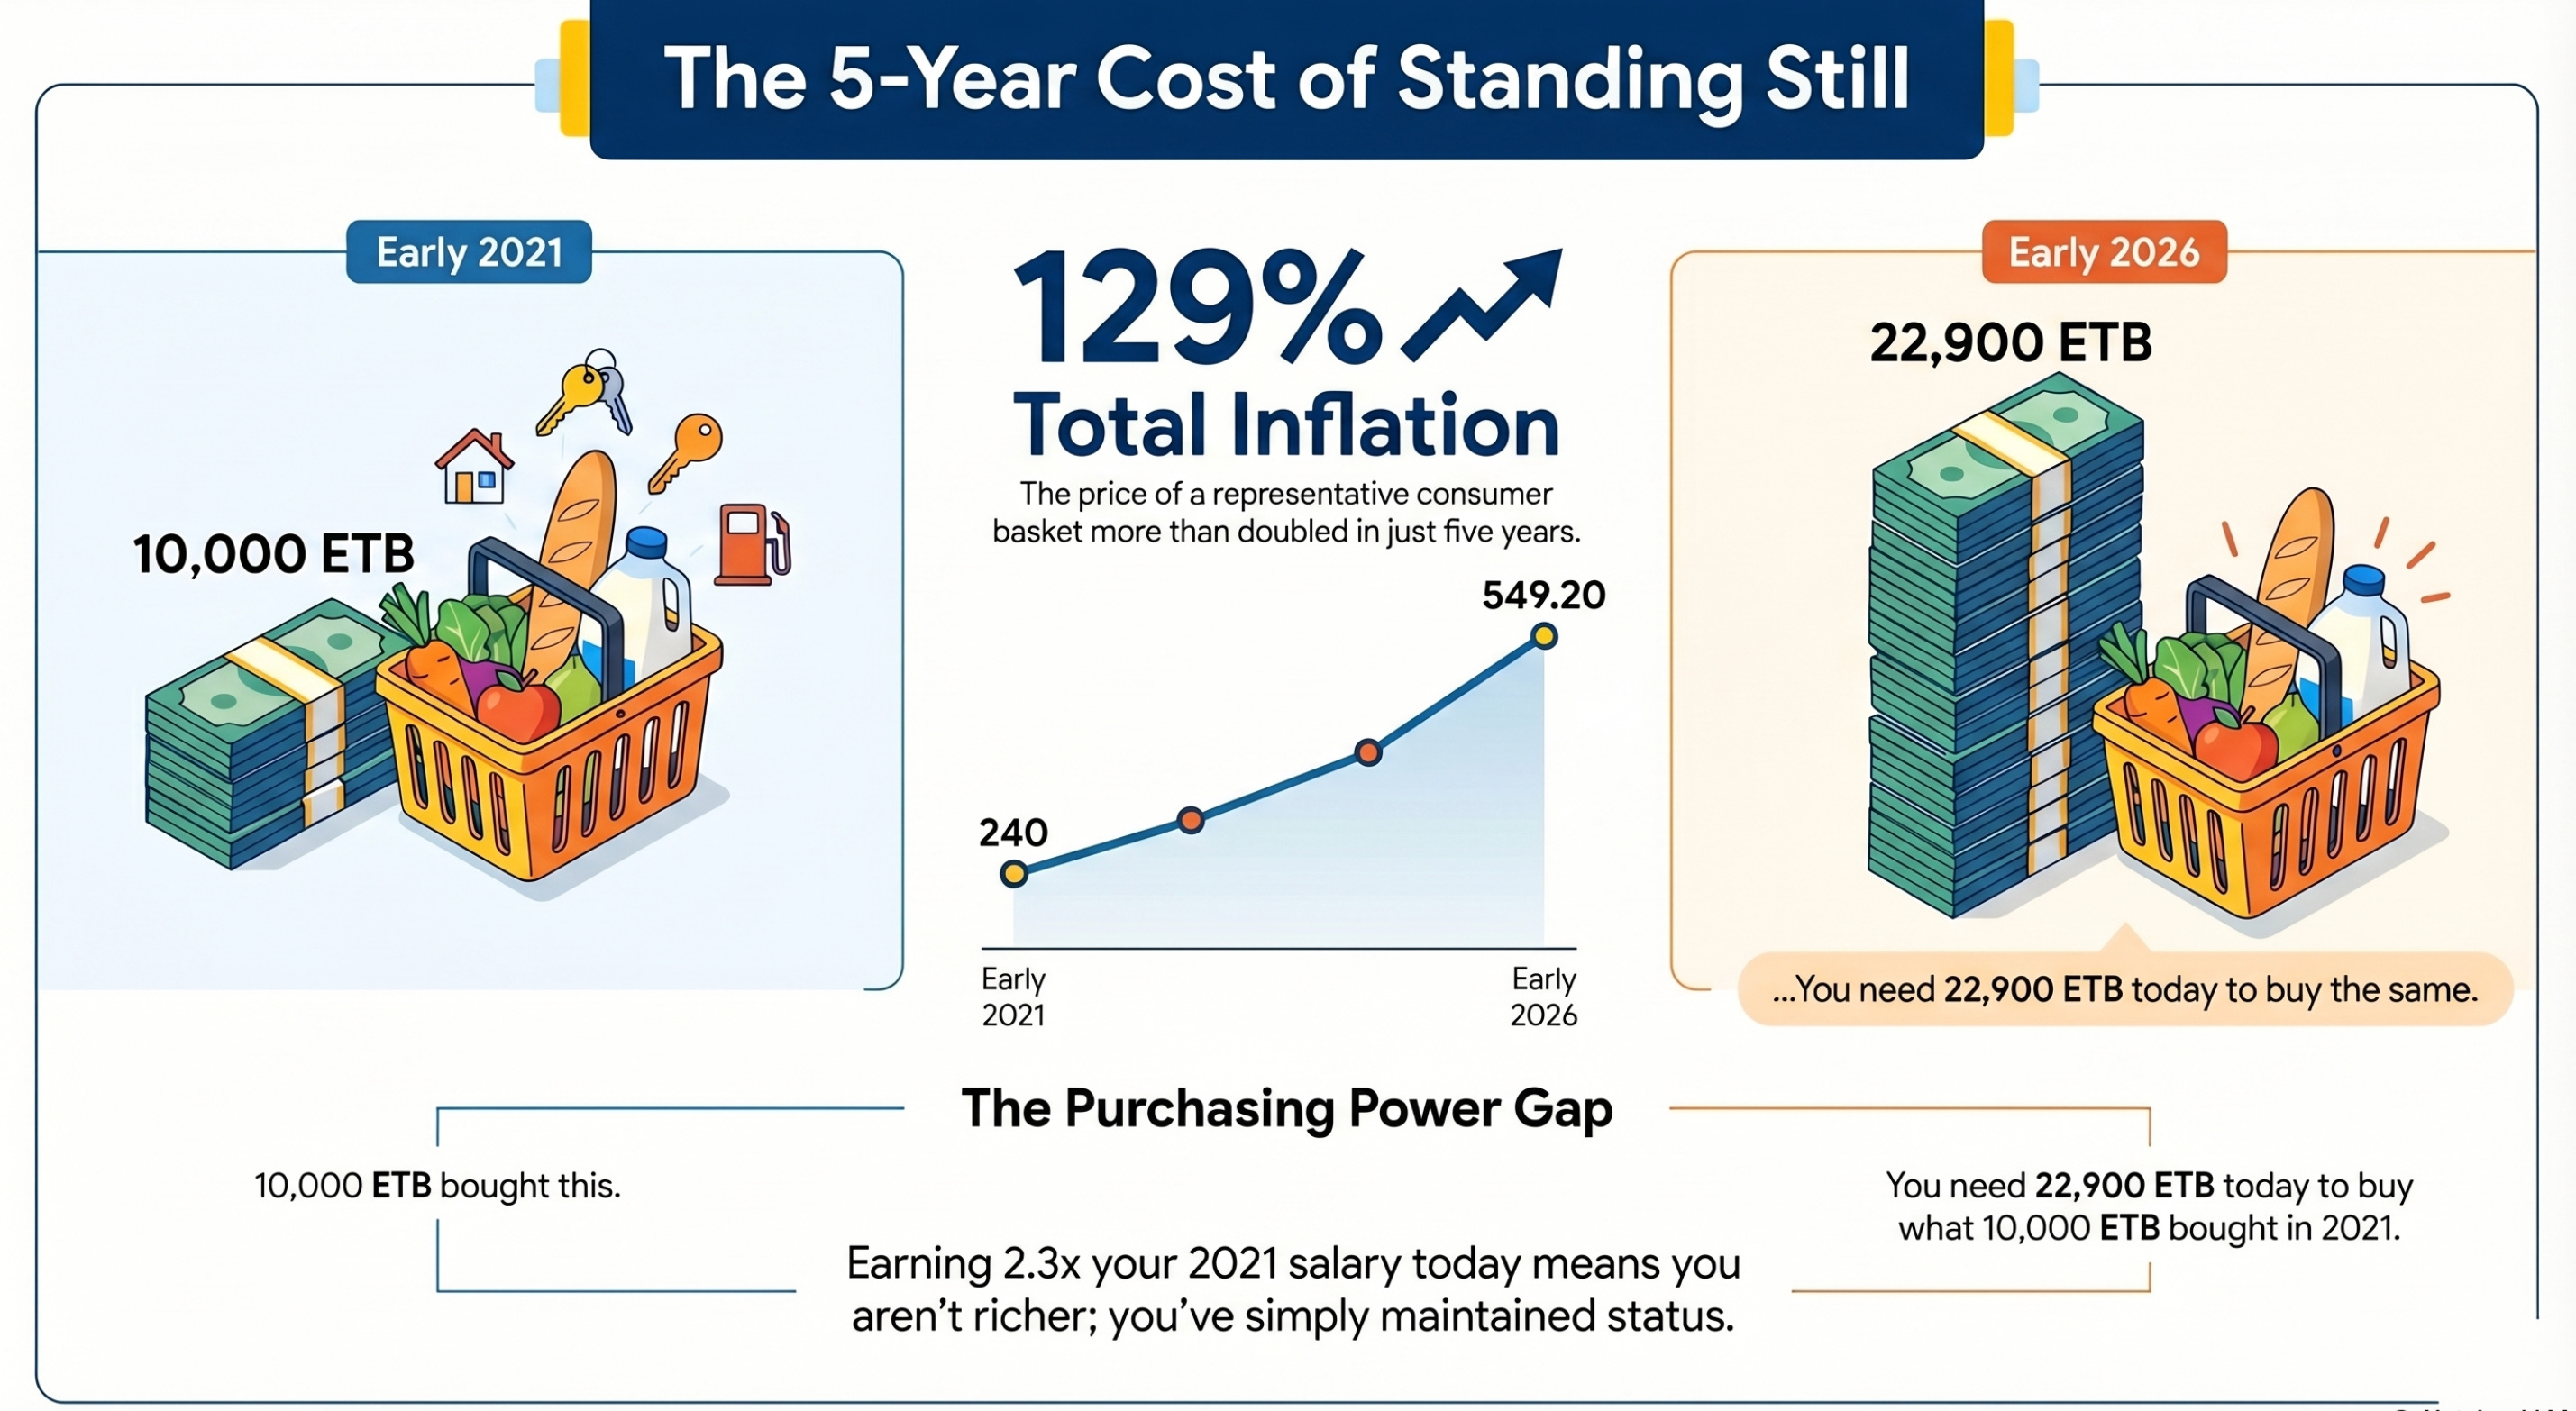
The Five-Year Reality
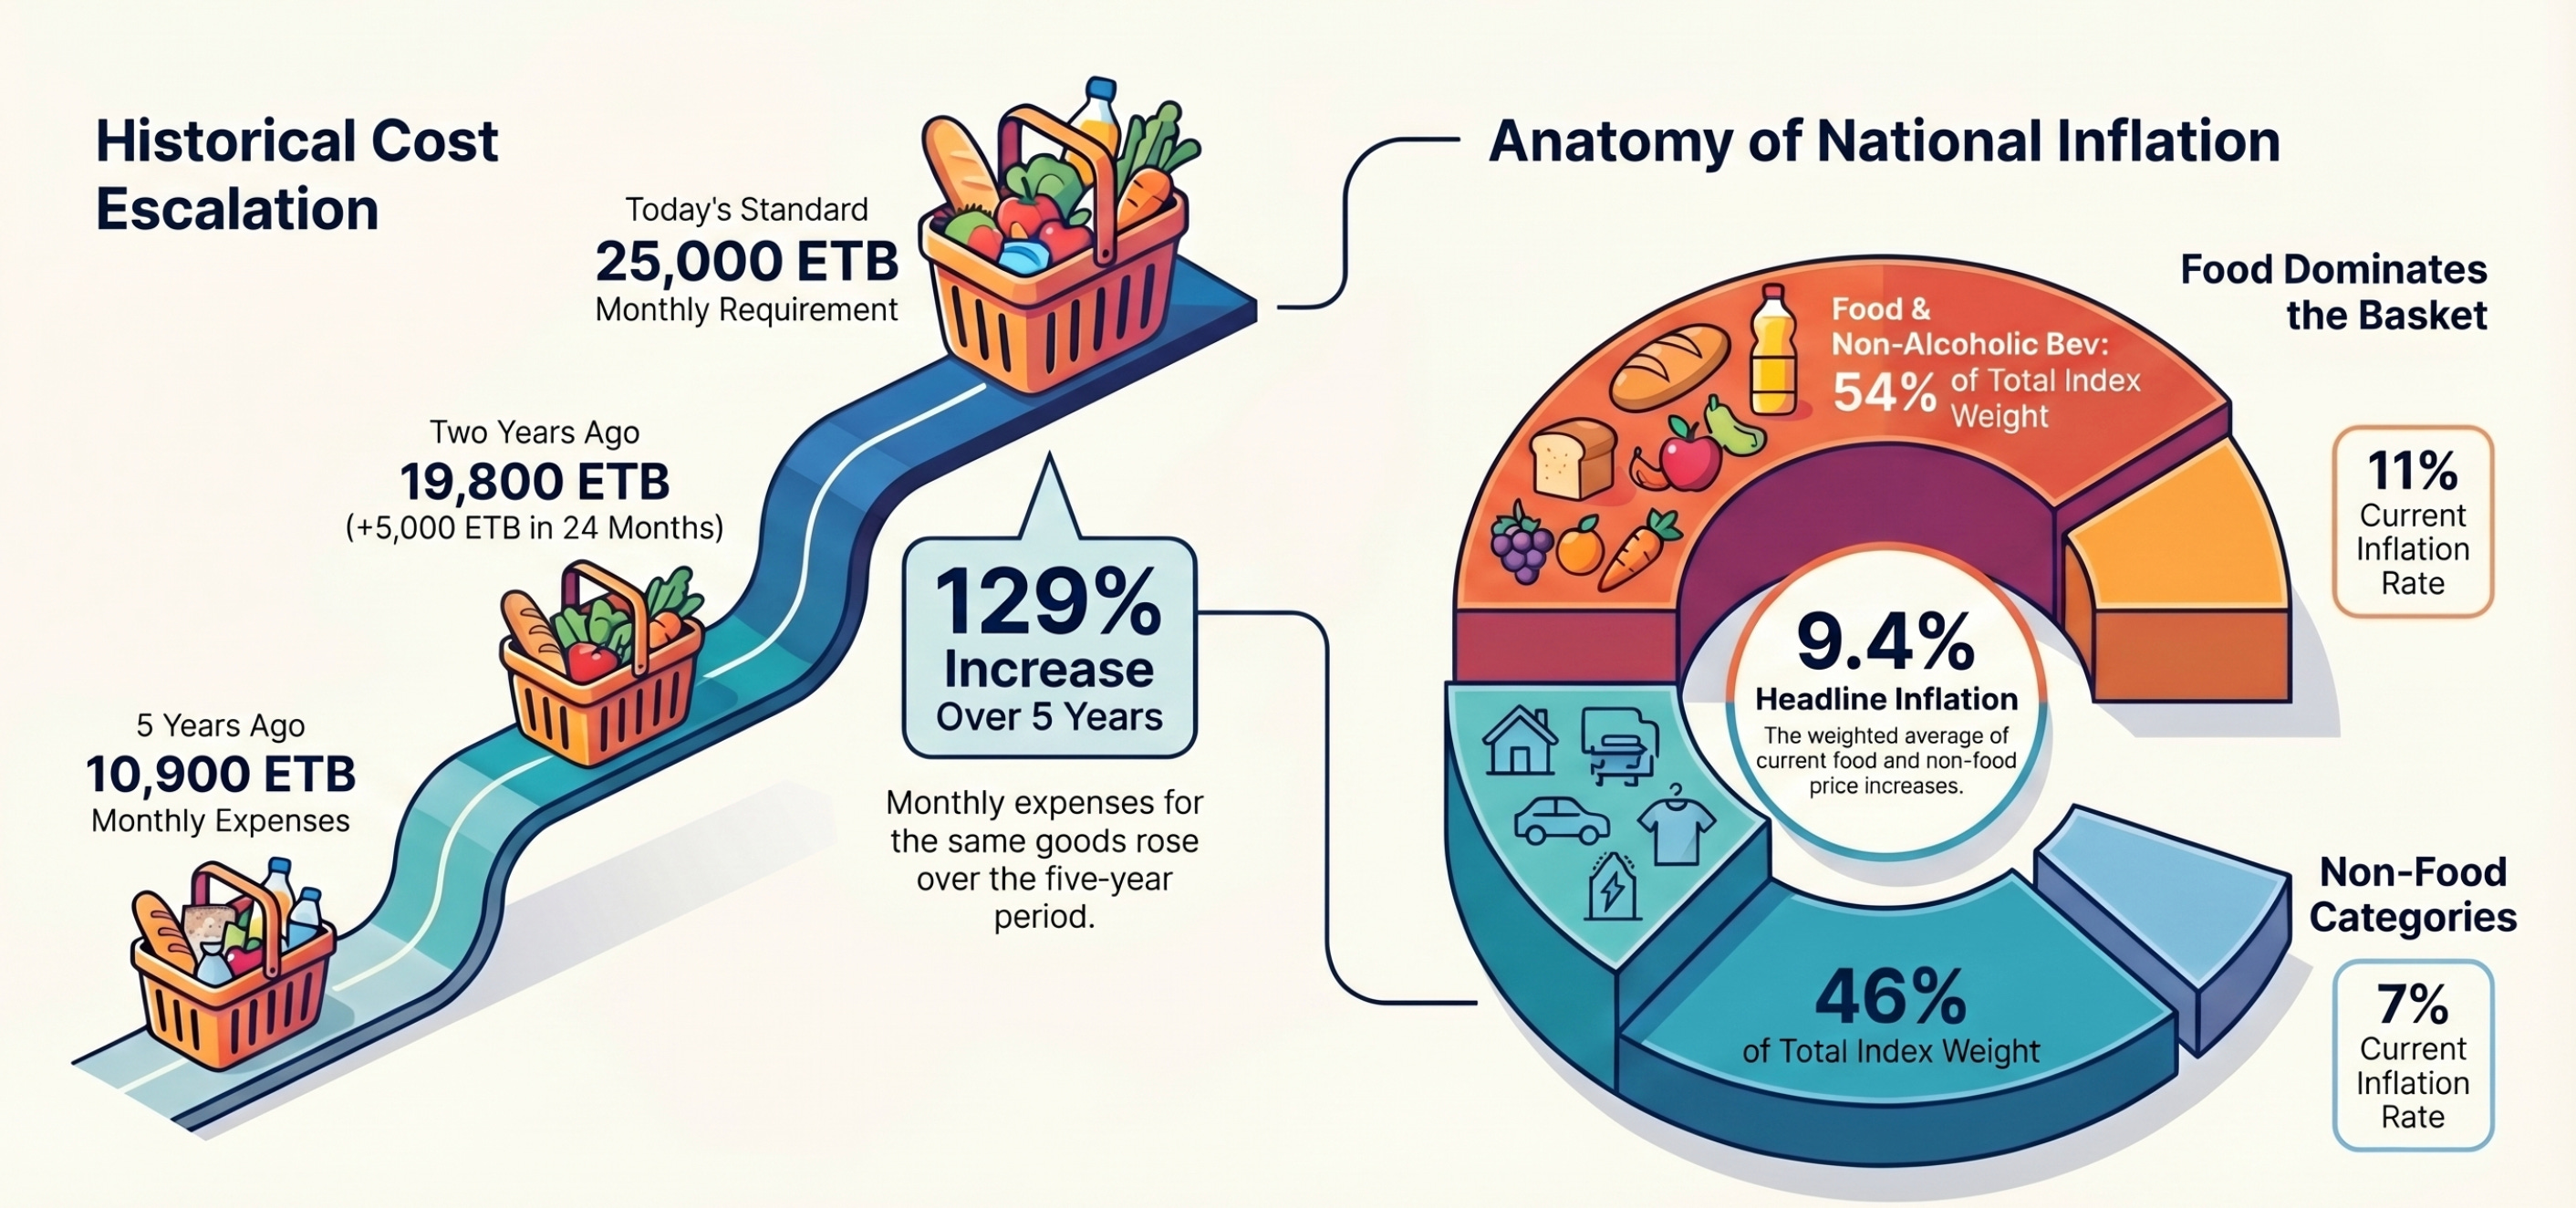
Over the five years from early 2021 to early 2026, the CPI moved from approximately 240 to 549.20. These are estimates derived from ESS trend data, and the exact monthly figures vary, but the directional picture is reliable. Here is the math:
((549.2 / 240) - 1) x 100 = approximately 129%
In five years, the price of the representative consumer basket more than doubled. Not by a small margin. By 129%. If in 2021 you were spending 10,000 ETB a month on the goods and services that make up that basket, you would need more than twice that amount today to buy the exact same things.
Takeaway: If someone’s salary in 2021 was 10,000 ETB per month, they would need to be earning at least 22,900 ETB today just to be standing still in terms of what their income can actually purchase. Not richer. Not growing. Standing still.
Most people’s salaries did not do that.
The Two-Year Hammer
The five-year number shows you where you have traveled. The two-year number tells you the speed at which you are still moving.
From approximately early 2024 to early 2026, ESS trend data suggests the CPI moved from around 435 to 549.20. These are approximate figures, and the precise monthly starting point affects the calculation, but the resulting pace is consistent with what official data shows. To calculate the average annual pace of this rise, you use the Compound Annual Growth Rate, or CAGR. Think of CAGR like the tempo of a song: not one loud note, but the steady beat that everything is moving to, year after year.
((549.2 / 435)^0.5 - 1) = approximately 12.36% per year
That is how much more expensive your life has become every single year, on average, for the past two years. The ESS’s own published 12-month moving average inflation figure for March 2026 is 12.0%, which is broadly consistent with this calculation and confirms the general order of magnitude.
The current headline rate is 9.4%. That is a snapshot, one year-over-year comparison. The 12.36% is the average tempo over a two-year window, and it captures something the headline misses. On July 29, 2024, Ethiopia moved to a market-based exchange rate for the first time in decades. On that day alone, the Birr moved from 57.48 to approximately 74.73 against the dollar. In the weeks that followed, the depreciation continued: by mid-August 2024 the rate had reached over 100 Birr per dollar, and by year-end it had reached approximately 128. Imported goods repriced at each stage. Medicine, electronics, cooking oil, spare parts, and industrial inputs did not inflate gradually. They moved in steps, and each step held. The 12-month snapshot can miss part of that movement because the measurement window only captures distance from one calendar point to another. The two-year CAGR sees the whole staircase.
This is not unique to Ethiopia. Turkey experienced exactly this dynamic in 2022 when the Lira devalued sharply. Nigeria saw it after the Naira float in 2023. In every case, the official year-over-year number lagged behind what households actually experienced, because the measurement window was narrower than the event itself.
Takeaway: Even if you received a salary increase that seemed generous, if it was below 12.36%, you are earning more Birr and living less well. That is not a feeling. That is arithmetic.
Why the Official Rate Feels Disconnected from Real Life
The official inflation rate is 9.4%. Many people, particularly families shopping in Merkato or at local neighborhood market stalls, find this number essentially meaningless when they stand in front of a price tag. They are not wrong to feel that way, though the reason is more precise than it might seem.
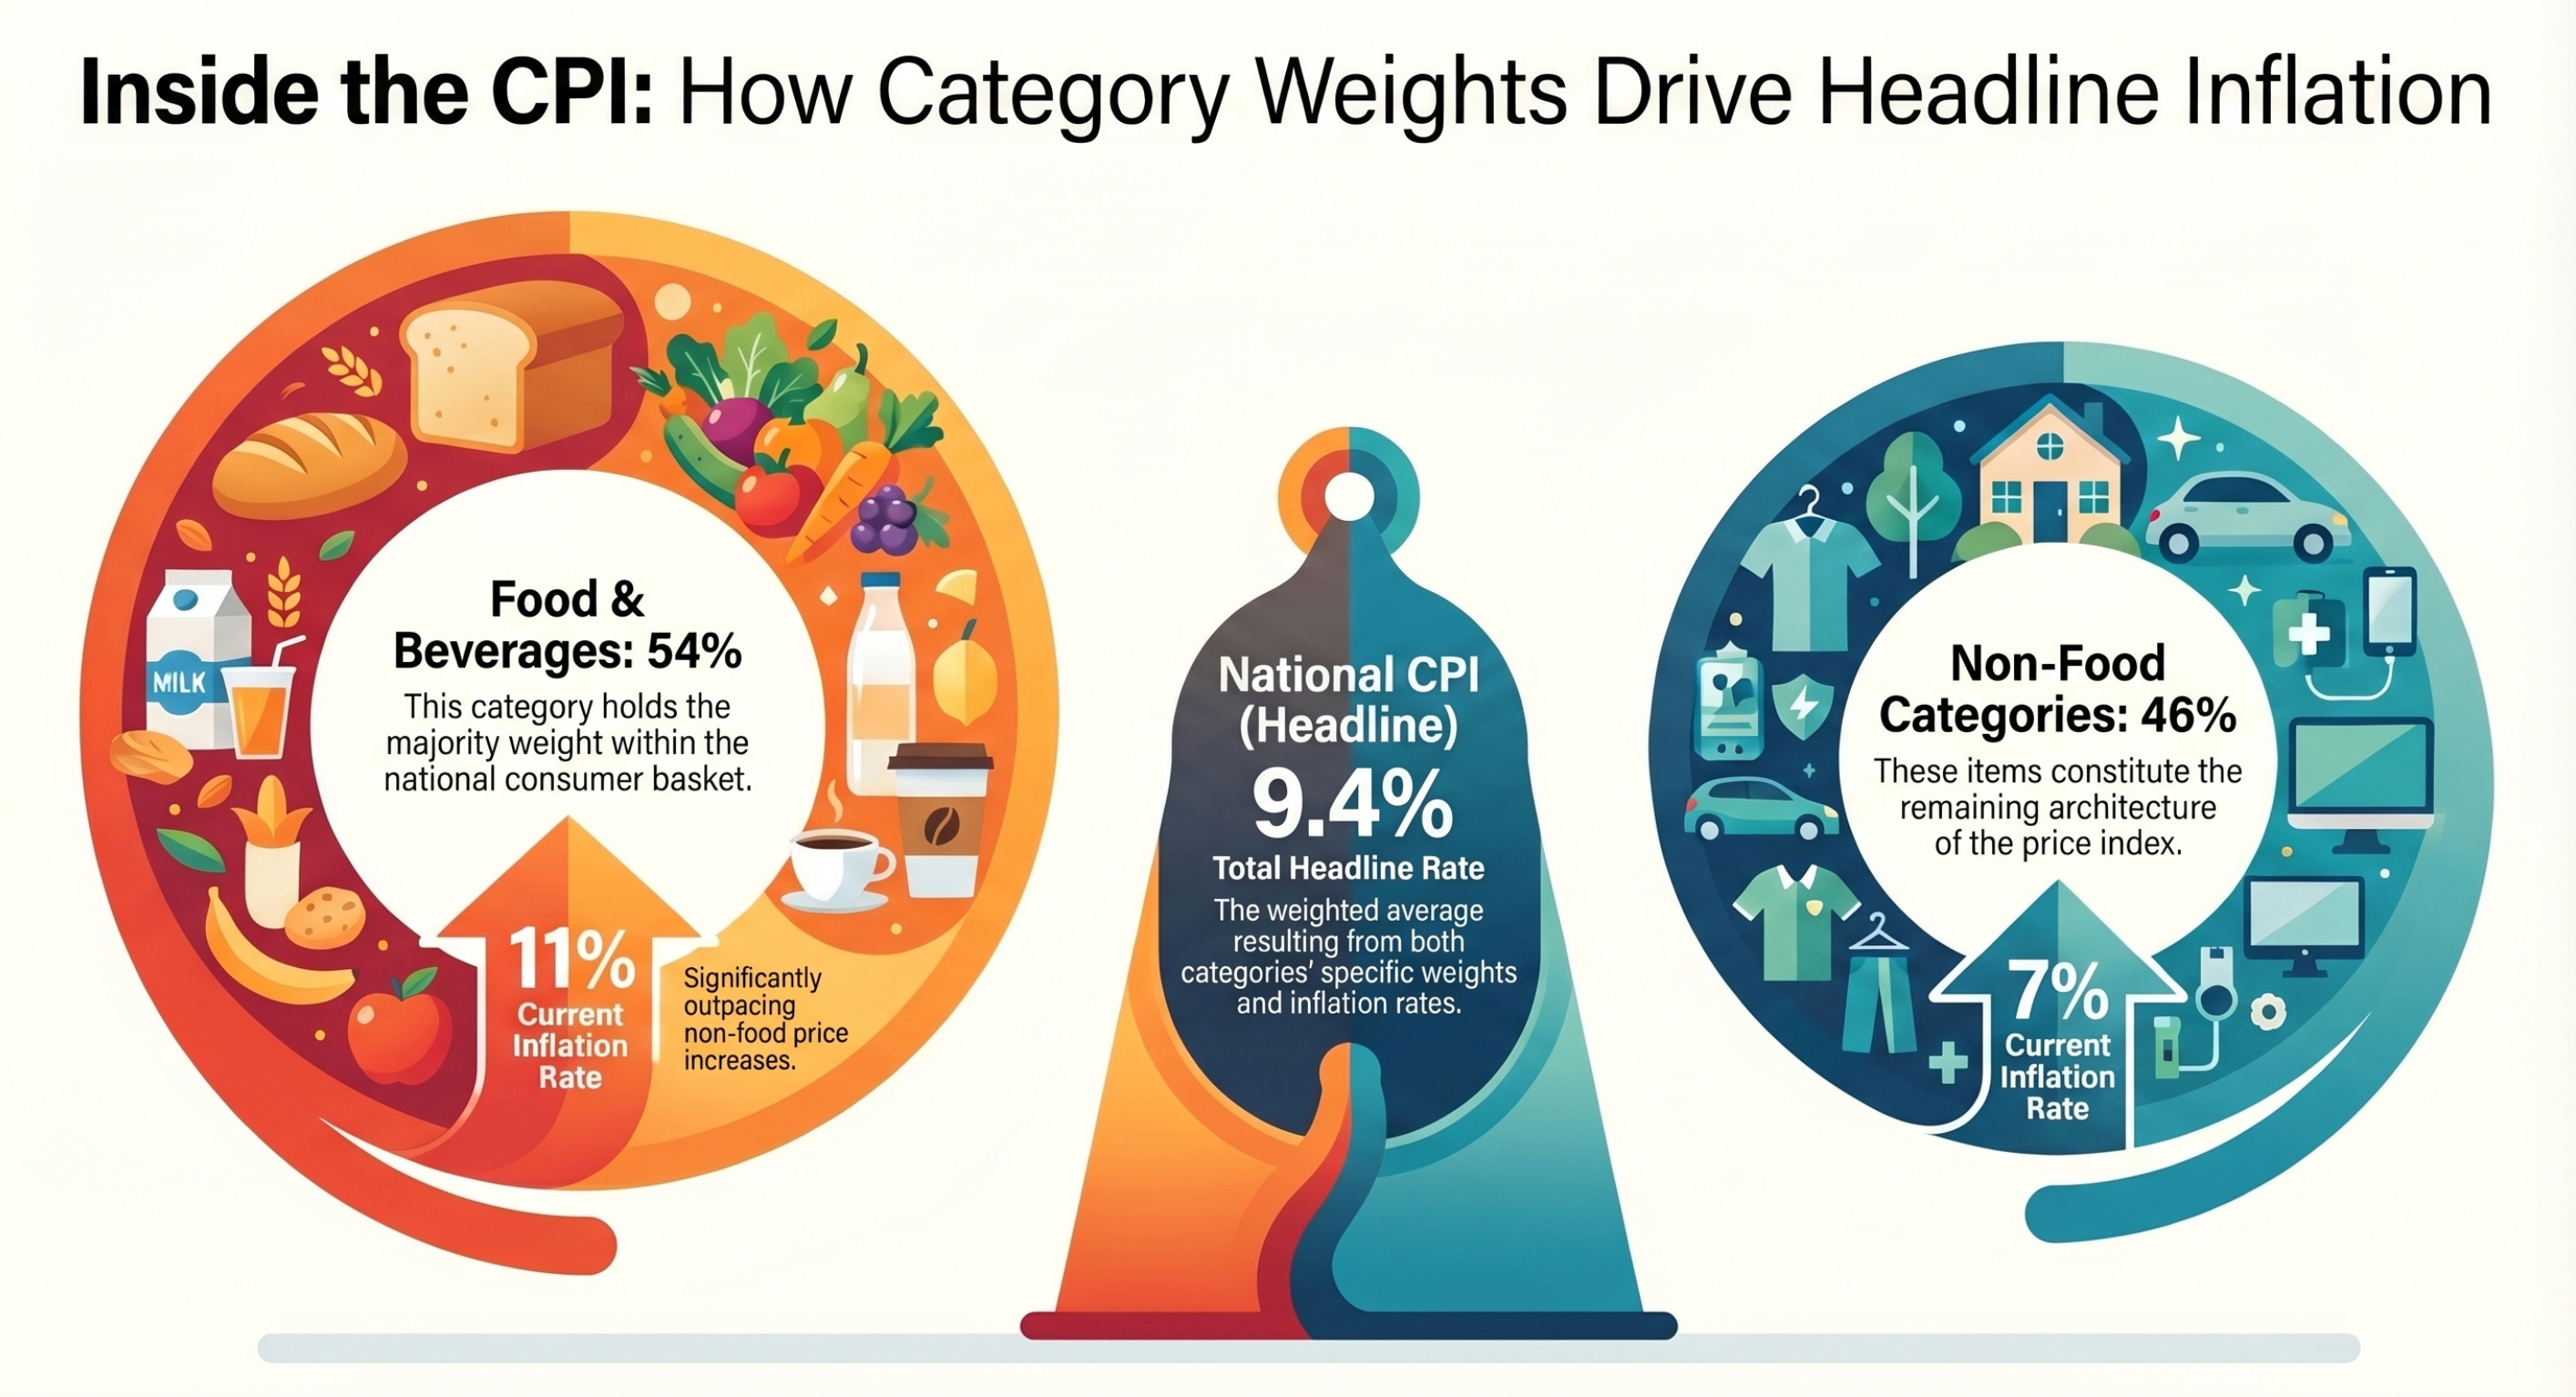
The national CPI is a weighted average. Food and non-alcoholic beverages carry 54% of the basket weight. Non-food categories carry the remaining 46%. Currently, food inflation is running at 11% and non-food inflation at 7%. The weighted average of those two components gives you the headline: roughly 9.4%.
For a household that spends 70% of its income on food rather than 54%, the personal inflation calculation shifts. The math is: (0.70 × 11%) + (0.30 × 7%) = 7.7% + 2.1% = 9.8%. Modestly higher than the official rate, not dramatically so. The numbers are close.
The real disconnect is not in the arithmetic. It is in the experience. A family spending nearly all of its income on food is exposed almost entirely to food prices. Teff, edible oil, vegetables, sugar: these are running at 11%. The family does not live inside the official basket, which smooths food inflation together with housing costs, transport, and services they may rarely purchase. They live inside the food portion of that basket, and 11% is what they encounter every week at the market. The headline rate of 9.4% is technically accurate as a population average. It just does not describe their specific life with any precision.
This divergence between official inflation and personal inflation is documented in many high-inflation economies. It is not a statistical error. It is what any average does when the underlying population has different spending habits.
The Real Cost of a Nominal Raise
Take someone earning 25,000 ETB per month today. To understand where they actually stand, you need to know what that purchasing power would have required at earlier points in time.
Approximately five years ago, a person living at today’s 25,000 ETB standard of living would only have needed approximately 10,900 ETB per month to afford the exact same basket of goods and services. Two years ago, that same standard would have required approximately 19,800 ETB. Today it requires 25,000 ETB.
Read that in reverse. An employee who earned 10,900 ETB five years ago and now receives 25,000 ETB appears to have received a 129% raise. In nominal Birr terms, that is exactly what happened. In real terms, they are standing at the same point they started. The raise was almost entirely absorbed by the change in prices. It bought them nothing new. It merely kept pace.
Many employees in that position are not earning 25,000 ETB today. Many are earning 15,000 or 17,000 ETB, receiving what felt like meaningful raises but landing well short of the number needed to maintain their prior standard of living. This is the silent pay cut. Nobody signed off on it. Nobody announced it. It arrived in the gap between what was given and what was needed.
The Manager’s Problem Is Not Generosity. It’s Math.
Companies that want to retain good people are facing a problem that has nothing to do with culture, appreciation, or goodwill. They are facing a mathematics problem, and it is the same mathematics problem that businesses face during any sustained high-inflation period anywhere in the world.
A business that earned 50 million ETB in revenue five years ago and now earns 115 million ETB looks like a company that has grown 130%. But if the general price level has also risen 129% over that same period, the real purchasing power of those revenues is almost identical to what it was then. The company grew in nominal terms, meaning the number got larger on paper, but it did not grow in real output or real capacity. It ran hard and stayed in the same place.
This matters enormously when deciding where raises come from. In a genuinely expanding company, salary increases can be funded from real new revenues, from growth that outpaced inflation and created a surplus that did not previously exist. But a business whose revenues merely tracked inflation has no new real surplus to distribute. The money has to come from somewhere that already existed, which means from margin compression, from operational efficiency, or from a very honest conversation about what the organization can and cannot sustain.
There is a version of this story that rarely gets told. A manager who genuinely wants to do right by their team, who has watched costs rise in their own home just as their staff have, who is sitting on margins that were thin before and are thinner now, being asked to close a gap that their revenue base was not designed to close. The raise they can offer is not a reflection of how much they value the person. It is a ceiling imposed by the arithmetic of their own business. Asking any company to close a 12.36% annual gap while its own operating costs are rising at the same pace is asking it to compress from both ends simultaneously. For employees, this is worth understanding before walking into that conversation. The manager’s constraint is usually real. The ceiling is usually the business, not the person behind the desk.
Takeaway: Retaining talent through an inflationary cycle is a question of whether the organization can afford to keep pace with the real cost of a person’s life. When revenue growth merely tracks inflation, the math becomes tight, and good intentions alone cannot close a gap that is measured in percentage points.
The Dollar Employers - A Different Game Entirely
Not every employer in Ethiopia is playing the same game. And understanding who is not subject to these Birr constraints helps explain one of the most significant talent dynamics currently reshaping Ethiopian workplaces.
International NGOs, United Nations agencies, embassy-linked organizations, and donor-funded development projects typically operate with budgets denominated in US dollars. Their costs, their salaries, and their financial planning sit in a currency that moves by entirely different rules. For employees in these organizations, the exchange rate shift of 2024 was not a crisis. In Birr terms, it was an enormous windfall.
Lets do the math on this - In January 2024, one US dollar exchanged for approximately 56 Birr. An employee earning $500 per month was receiving the equivalent of roughly 28,000 ETB. By early 2026, with the exchange rate at approximately 157 Birr per dollar, that same $500 monthly salary now converts to approximately 78,500 ETB. The dollar amount did not change. The Birr equivalent nearly tripled.
((78,500 / 28,000) - 1) x 100 = approximately 180% nominal Birr gain
Over that same period, the CPI rose by approximately 26%. To calculate how much real purchasing power actually changed, you divide the nominal income gain by the price level increase:
(1 + 1.80) / (1 + 0.26) - 1 = 2.80 / 1.26 - 1 = approximately 122%
You read this as: a person whose salary was pegged to the dollar in January 2024 gained approximately 122% in real purchasing power by early 2026, not because they negotiated a better salary, but because the exchange rate moved. A Birr-paid worker earning the same number of dollars’ worth of Birr in January 2024 would need their salary to have grown by 26% just to stand still. The dollar-paid worker is, by this measure, roughly 122 percentage points ahead, through no additional effort on either side.
This creates a labor market where two categories of worker can sit at neighboring desks in the same city, doing comparable work, and experience inflation in completely opposite directions. The Birr-paid worker is fighting to preserve purchasing power against a 12.36% annual erosion. The dollar-paid worker watched their effective Birr income surge past inflation by a magnitude that no ordinary local salary negotiation could come close to replicating.
For employers operating with Birr revenues, the consequences are concrete. When a skilled accountant, engineer, program officer, or communications professional calculates that a role at an international organization pays the dollar equivalent of three or four times what a local firm can offer in Birr, the decision is rarely complicated. This is not disloyalty. It is math.
What this produces over time is a recognizable organizational pattern that appears across many developing economies with active international sectors. Local companies, often with stronger training cultures, more structured career development, and more intensive investment in junior staff, end up functioning as preparation ground for talent that eventually moves to the dollar-denominated sector. The local employer absorbs the cost of developing the person. The international employer, with structural currency advantages that have nothing to do with their own operational quality, captures the result.
The irony is that the local firms doing the most to invest in their people are often the most exposed to this drain, precisely because well-trained, capable staff are the most attractive candidates for international roles. A company that takes a junior hire seriously, trains them, promotes them, and builds their capability over three years is, in many cases, building a candidate for a competitor it cannot out-price.
There is no simple correction for this. The currency differential is a macroeconomic fact, not a policy that any individual employer can override. But understanding it changes the framing of retention conversations. When a good employee leaves for an international organization, a manager should not read that primarily as a reflection of culture or compensation effort. It is evidence of a gap that local Birr revenues, absent genuine real growth, cannot arithmetically close.
Takeaway: In any economy where dollar-pegged employers coexist with Birr-revenue businesses, the labor market is not flat. It has a slope. Talent flows in the direction that currency mathematics dictates, and the companies that understand this are the ones that plan around it rather than being repeatedly surprised by it.
There is one further complication. The dollar-paying roles are not abundant. There are only so many UN positions, NGO program officer seats, and embassy contracts in Addis Ababa. Most people will not get one. But that scarcity does not contain the distortion. It spreads it.
When a colleague lands a dollar-pegged role and their effective Birr income triples, the information travels. Word moves through professional networks, LinkedIn timelines, and lunch conversations. A developer who earns 30,000 ETB per month at a local firm learns that a peer doing similar work at an international organization is effectively earning the Birr equivalent of 80,000 or 90,000. The peer got lucky with access to a scarce opportunity. But the reference point does not feel like luck to the person who now holds it. It feels like market information. And it recalibrates what feels acceptable.
This is how a thin layer of dollar-denominated employment reshapes salary expectations across an entire labor market. The roles are few. The price signal they emit is loud. A private sector manager making a genuine effort to offer competitive Birr compensation is now negotiating not just against what their revenues can support, but against a benchmark that their revenues structurally cannot reach. The employee is not being unreasonable. The manager is not being stingy. They are both responding rationally to information from a market that is distorted by the presence of a currency that does not belong to either of them.
The Upwork Layer
There is a third category that sits outside formal employment entirely and adds its own pressure to this dynamic.
Platforms like Upwork, Toptal, and Fiverr have made it possible for a software developer, graphic designer, copywriter, or data analyst in Addis Ababa to sell their time directly to clients in the United States, Europe, or the Gulf, billed in dollars, euros, or pounds. In practice, these workers are functioning as solo BPO operations, satellite knowledge-work partners connected to the global economy through a platform rather than a corporate contract. The geography is Ethiopian. The pricing is international.
The arithmetic is the same as it is for the NGO employee, except the worker controls it themselves. A freelance developer billing $25 per hour on Upwork for twenty hours a week is generating approximately 157,000 ETB per month at the current exchange rate. A local tech firm offering that same developer 40,000 ETB per month in a salaried role is not offering a bad salary by Ethiopian market standards. It is offering roughly a quarter of what the developer can generate independently, working part-time, from their apartment.
This creates what economists call geographic arbitrage: the same skill, applied to the same category of work, priced by the market where the client sits rather than the market where the worker lives. The client pays developing-world rates by their own standard. The worker receives developed-world rates by the standard of their local cost of living. Both parties benefit. The local private sector employer, whose pricing is anchored to the Ethiopian market and whose revenues are denominated in Birr, cannot participate in that exchange at all.
What results is a negotiation environment where the knowledge-worker private sector in Ethiopia is effectively competing against the global gig economy for the same talent pool, using a currency and a revenue base that are structurally disadvantaged in that competition. A company offering 50,000 ETB per month to a senior developer is making a serious offer. The developer with an Upwork profile and a client base knows the math. They are doing it in their head before the conversation begins.
Nobody in this picture is behaving badly. The freelancer is pursuing rational self-interest. The NGO is paying what its donor budget allows. The local employer is offering what its Birr revenues support. The distortion is not a failure of any individual actor. It is the shape of a local labor market that has been opened, unevenly and asymmetrically, to global price discovery, without the local revenue base having gone through the same transformation.
Takeaway: The private sector knowledge-work employer in Ethiopia today is not negotiating against local competitors alone. They are negotiating against a dollar-denominated international economy that their business model was never designed to match. The talent they are trying to retain has access to that economy through a laptop and a platform account. Understanding this does not solve the problem, but it does clarify what the problem actually is.
The Survival Equation
There is a single equation that should be visible in every salary review conversation right now.
Real Progress = Income Growth Rate - Inflation Rate
This is an approximation, not a precise formula, but it is accurate enough for any working decision. The only part of your raise that actually improves your life is whatever exceeds the pace at which your costs are growing. If your costs are growing at 12.36% per year and your salary grows at 10%, you are not 10% richer. You are approximately 2.36% poorer. Every morning you wake up in that situation, you are taking a quiet pay cut without anyone having called it that.
A 15% raise in a 12.36% inflation environment is a real gain of approximately 2.4%. A 10% raise in the same environment is a real loss of approximately 2.1%. Psychologically, those two outcomes feel very different. In real terms, they are about four percentage points apart, and both of them are close to zero.
The question is never whether a raise happened. The question is whether the raise outpaced the rhythm of inflation.
For employees: the number to benchmark against is not your prior salary. It is what your prior salary would need to be today to buy the same things it bought two years ago. That calculation requires the 12.36% two-year CAGR, not the 9.4% single-year headline.
For managers: the question is not what the company can generously offer. It is whether what the company offers closes the real gap or merely acknowledges it symbolically. Symbolic raises cost money and erode trust simultaneously, which is a poor outcome for everyone in the room.
It is worth remembering that this is not a uniquely Ethiopian condition, and it is not a permanent one. Every economy in the world, from the United States and Western Europe to Turkey, Argentina, Brazil, and across Africa, has lived through periods where wages and prices fall out of step and the math of daily life feels harder than the headlines suggest. This is what economic transitions look like from the inside. The temptation in that moment is to pass the pressure to the nearest available person, an employer, a colleague, a number on a page. But clarity is more useful than blame. Understanding where you stand and why the gap exists is the most honest thing you can do with the information you now have.
Your Personal Inflation Tracker: The Tip You Came For
Here is the practical method. Now that you have read this far, you will actually know what to do with it.
Ethiopia publishes monthly CPI data through the Ethiopian Statistics Service. The reports are public and available online. Each monthly release contains two numbers you want: the overall CPI and the food CPI sub-index. Write them down when published. This takes two minutes.
Step one: note the current overall CPI and the CPI from exactly 12 months earlier. Calculate:
((Current CPI / Prior Year CPI) - 1) x 100. That is your official annual inflation rate.
Step two: do the same using the food CPI sub-index. If your household spends significantly more than 54% of its income on food, the food inflation number reflects your spending reality more closely than the blended headline. Compare the two figures, and use them to estimate your personal rate by weighting food and non-food according to how you actually spend.
Step three: every time you receive a salary adjustment, calculate your nominal raise as ((New Salary / Old Salary) - 1) x 100. Then subtract your personal inflation rate. What remains is your real raise. Positive means your purchasing power genuinely improved. Negative means you received a nominal raise and a real pay cut, regardless of how it was framed.
Step four, for the more ambitious: to calculate the two-year CAGR yourself, find the CPI from 24 months ago in the ESS archive. The formula is ((Current CPI / CPI Two Years Ago)^0.5 - 1) x 100. This gives you the average annual pace of cost increases across the full two-year window, which smooths out one-time events and reflects sustained price movement more honestly than any single annual snapshot.
Keep a simple monthly record: the date, overall CPI, food CPI, and your current salary. In twelve months you will have a personal economic log that is more honest about your financial position than any headline, and you will walk into your next salary conversation holding real numbers instead of a vague feeling that something is off.
Takeaway: The number you negotiate with is not the number in the news. It is the number in your own calculation. The data is public. The math is four steps. The difference between doing it and not doing it is the difference between knowing what you are asking for and guessing.
The salary raise problem is not a personal failing on either side of the desk. It is what happens when the cost of a life moves faster than the systems designed to compensate people for their work. Ethiopia is navigating a version of this that is real and measurable, and it is doing so alongside many other economies that have walked similar paths. The CPI score moved from 100 to 549.20. The 129% five-year cost increase has outpaced most formal salary structures. The 12.36% two-year CAGR is the tempo your household budget is moving to, regardless of what any single headline says.
Progress is still possible. It just requires knowing the real number, not the nominal one.
STRATEX by Naz covers the intersection of cognitive science, behavioral research, and business strategy. If this kind of analysis is useful to you, subscribe below..